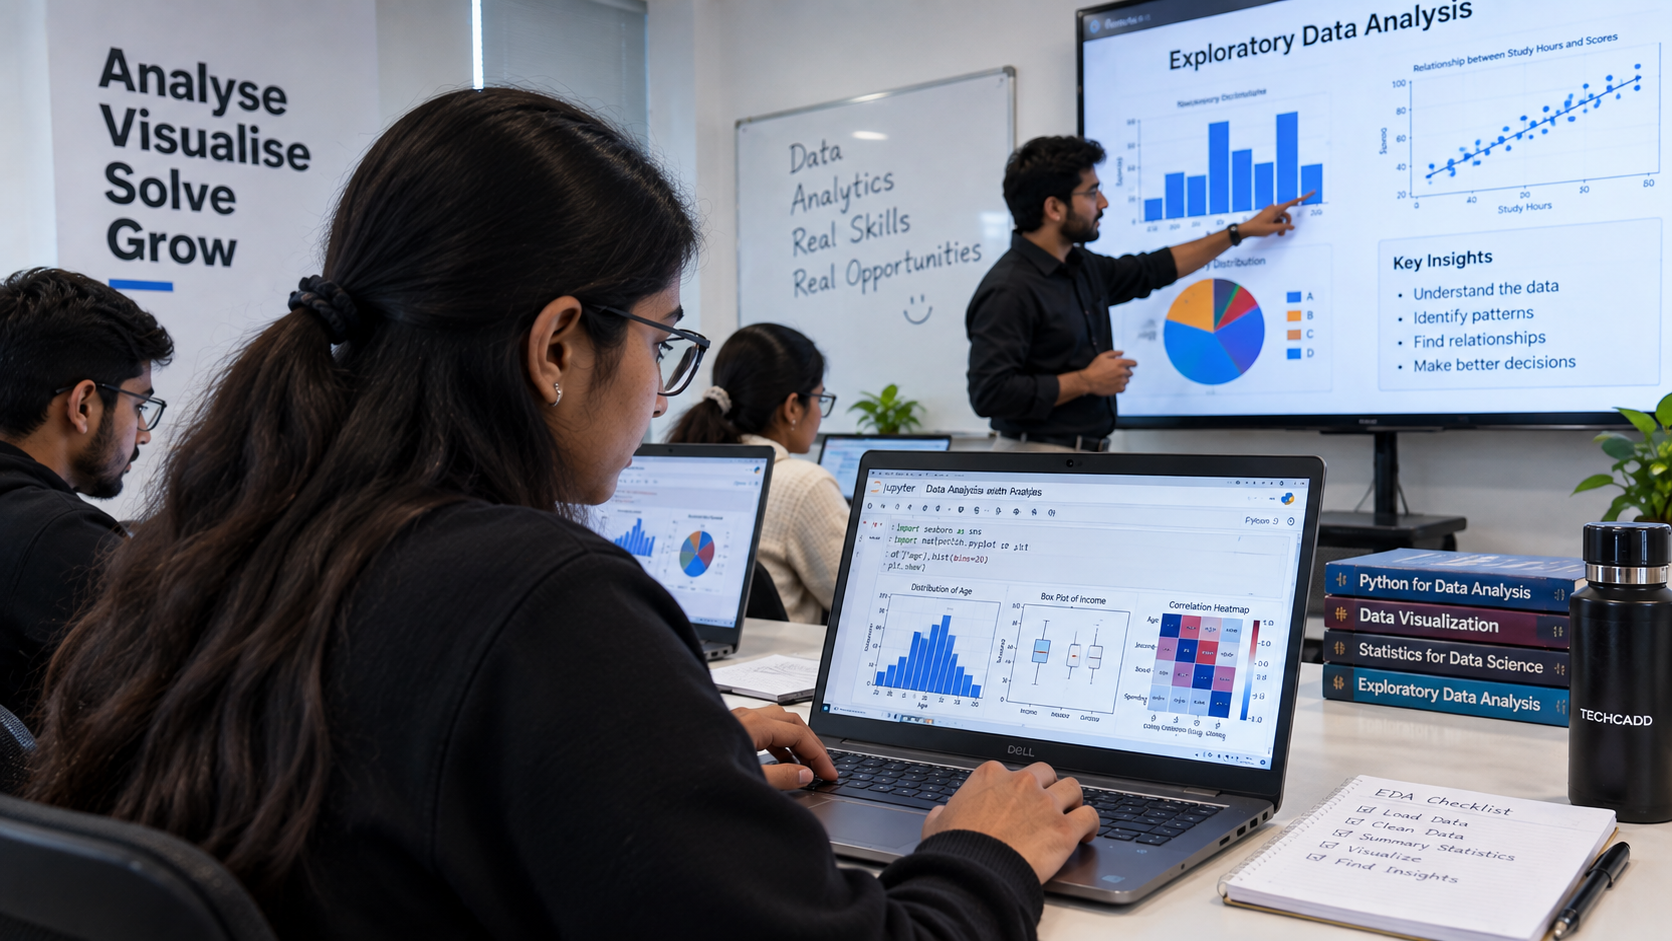
Turn structured datasets into clear findings through statistics, exploration and visualisation.
Learn how to explore, summarise and visualise datasets using Python, descriptive statistics, Matplotlib and Seaborn. Build practical EDA skills through structured analysis and reporting.
Learn Data Analytics with Python through practical experience
The Data Analytics Course in Ludhiana develops practical skills in exploratory data analysis, descriptive statistics and Python-based visualisation.
Learners examine structured datasets, calculate useful statistical summaries and investigate distributions, comparisons and relationships between variables.
Matplotlib and Seaborn are used to convert analytical findings into charts that are easier to interpret and communicate.
The practical outcome is a structured EDA report combining data observations, statistics and visual evidence.
Exploratory Data Analysis
Descriptive statistics
Matplotlib
Seaborn
Data visualisation
EDA reporting
Who can join
Who this Data Analytics with Python course is for
This course is for learners who can work with basic structured data and want to develop practical analytical and visualisation skills.
Aspiring Data Analysts
Learn how to examine datasets, calculate descriptive statistics and communicate findings visually.
Python Learners
Progress from Python data handling into practical exploratory analysis and visualisation.
College Students
Develop analytical thinking and practical EDA skills using structured datasets.
Working Professionals
Learn a repeatable approach to summarising, comparing and presenting business or operational data.
What you actually need before day one
Flexible batches · hybrid
A laptop or desktop — we help you set it up in the first session
A stable internet connection for the online batches
No prior coding or technical background
Basic English reading — the tools and their documentation are in English
About 6-8 hours a week outside class for practice
Willingness to finish the lab task before the next class
Not sure which of these you are, or whether the timing works around what you already do? That is exactly what the call is for. Ask about Data Analytics with Python
The case for it
Clean Data Still Needs Interpretation
A prepared dataset becomes useful only when someone can analyse it correctly. EDA combines statistics and visualisation to identify patterns, distributions, comparisons and relationships before deeper modelling begins.
3Core analysis stagesExplore, analyse and visualise
Review columns, values, data types and overall structure before beginning analysis.
Use descriptive statistics to understand typical values, ranges and frequency patterns.
Use Matplotlib and Seaborn to examine distributions, comparisons and relationships.
Combine numerical summaries and visual evidence into a structured EDA report.
What you will learn
A path from first steps to shipped work
The syllabus moves from understanding dataset structure into statistical summaries and visual exploration. Learners then combine those skills to complete a practical exploratory data analysis report.
5 learning modules01 / 05
Module 01
Exploratory Data Analysis Fundamentals
Learn a systematic process for understanding what a dataset contains before attempting deeper analysis.
Skills you build
Introduction to EDA
Dataset inspection
Data types
Column analysis
Missing-value review
Unique values
Value counts
Identifying unusual observations
Tools & libraries
You finish with
Dataset exploration summary
Every module contributes to the final EDA report by moving from dataset inspection to statistical and visual interpretation.
What you learn
What You Will Learn in Data Analytics
Learn a practical process for understanding datasets through exploratory analysis, descriptive statistics and visualisation.
01
Exploratory analysis
Use EDA techniques to understand dataset structure, values and potential issues.
02
Descriptive statistics
Use mean, median, mode, ranges and frequencies to summarise information.
03
Matplotlib
Create charts that show trends, comparisons, distributions and relationships.
04
Seaborn
Use statistical visualisation to investigate patterns and compare groups.
05
Analytical thinking
Learn to choose suitable statistics and visuals according to the question being investigated.
06
EDA reporting
Combine data observations, statistics and charts into a structured exploratory analysis report.
Tools you’ll work with
Pyhton
Pandas
Matplotlib
Seaborn
The objective is to move from simply viewing a dataset to explaining what its values, patterns and relationships actually show.
Find your pace
What you can do, phase by phase
The Data Analytics with Python syllabus in the order you meet it, and what you are able to do by the end of each stretch of it. Every row is a capability, not a topic you sat through.
Every capability in the Data Analytics with Python syllabus, and the phase it is covered in
Capability
Foundations
Applied
Professional
Introduction to EDAExploratory Data Analysis Fundamentals
Covered in Foundations
Covered in Applied
Covered in Professional
Dataset inspectionExploratory Data Analysis Fundamentals
Covered in Foundations
Covered in Applied
Covered in Professional
Data typesExploratory Data Analysis Fundamentals
Covered in Foundations
Covered in Applied
Covered in Professional
Column analysisExploratory Data Analysis Fundamentals
Covered in Foundations
Covered in Applied
Covered in Professional
Missing-value reviewExploratory Data Analysis Fundamentals
Covered in Foundations
Covered in Applied
Covered in Professional
Unique valuesExploratory Data Analysis Fundamentals
Covered in Foundations
Covered in Applied
Covered in Professional
Value countsExploratory Data Analysis Fundamentals
Covered in Foundations
Covered in Applied
Covered in Professional
Identifying unusual observationsExploratory Data Analysis Fundamentals
Covered in Foundations
Covered in Applied
Covered in Professional
MeanDescriptive Statistics
Covered in Foundations
Covered in Applied
Covered in Professional
ModeDescriptive Statistics
Covered in Foundations
Covered in Applied
Covered in Professional
MedianDescriptive Statistics
Covered in Foundations
Covered in Applied
Covered in Professional
Minimum and maximumDescriptive Statistics
Covered in Foundations
Covered in Applied
Covered in Professional
RangeDescriptive Statistics
Covered in Foundations
Covered in Applied
Covered in Professional
FrequencyDescriptive Statistics
Covered in Foundations
Covered in Applied
Covered in Professional
PercentagesDescriptive Statistics
Covered in Foundations
Covered in Applied
Covered in Professional
Basic probability conceptsDescriptive Statistics
Covered in Foundations
Covered in Applied
Covered in Professional
Matplotlib fundamentalsData Visualisation with Matplotlib
–Not yet covered in Foundations
Covered in Applied
Covered in Professional
Line chartsData Visualisation with Matplotlib
–Not yet covered in Foundations
Covered in Applied
Covered in Professional
Bar chartsData Visualisation with Matplotlib
–Not yet covered in Foundations
Covered in Applied
Covered in Professional
HistogramsData Visualisation with Matplotlib
–Not yet covered in Foundations
Covered in Applied
Covered in Professional
Scatter plotsData Visualisation with Matplotlib
–Not yet covered in Foundations
Covered in Applied
Covered in Professional
Pie chartsData Visualisation with Matplotlib
–Not yet covered in Foundations
Covered in Applied
Covered in Professional
Labels and titlesData Visualisation with Matplotlib
–Not yet covered in Foundations
Covered in Applied
Covered in Professional
Chart interpretationData Visualisation with Matplotlib
–Not yet covered in Foundations
Covered in Applied
Covered in Professional
Seaborn fundamentalsStatistical Visualisation with Seaborn
–Not yet covered in Foundations
Covered in Applied
Covered in Professional
Distribution plotsStatistical Visualisation with Seaborn
–Not yet covered in Foundations
Covered in Applied
Covered in Professional
Category comparisonStatistical Visualisation with Seaborn
–Not yet covered in Foundations
Covered in Applied
Covered in Professional
Scatter relationshipsStatistical Visualisation with Seaborn
–Not yet covered in Foundations
Covered in Applied
Covered in Professional
Box plotsStatistical Visualisation with Seaborn
–Not yet covered in Foundations
Covered in Applied
Covered in Professional
HeatmapsStatistical Visualisation with Seaborn
–Not yet covered in Foundations
Covered in Applied
Covered in Professional
Visual interpretationStatistical Visualisation with Seaborn
–Not yet covered in Foundations
Covered in Applied
Covered in Professional
Chart selectionStatistical Visualisation with Seaborn
–Not yet covered in Foundations
Covered in Applied
Covered in Professional
Define analysis questionsExploratory Data Analysis Project
–Not yet covered in Foundations
–Not yet covered in Applied
Covered in Professional
Inspect the datasetExploratory Data Analysis Project
–Not yet covered in Foundations
–Not yet covered in Applied
Covered in Professional
Calculate statisticsExploratory Data Analysis Project
–Not yet covered in Foundations
–Not yet covered in Applied
Covered in Professional
Explore distributionsExploratory Data Analysis Project
–Not yet covered in Foundations
–Not yet covered in Applied
Covered in Professional
Compare categoriesExploratory Data Analysis Project
–Not yet covered in Foundations
–Not yet covered in Applied
Covered in Professional
Examine relationshipsExploratory Data Analysis Project
–Not yet covered in Foundations
–Not yet covered in Applied
Covered in Professional
Create visualisationsExploratory Data Analysis Project
–Not yet covered in Foundations
–Not yet covered in Applied
Covered in Professional
Document findingsExploratory Data Analysis Project
–Not yet covered in Foundations
–Not yet covered in Applied
Covered in Professional
The full programme runs Flexible batches. Where you finish is a question of pace rather than of syllabus — everyone covers all of it.
Technology ecosystem
One discipline. A mesh of real tools.
Data Analytics with Python is the centre. These are the tools you use around it in a working team.
Data Analytics with Pythoncore skill
Programming Language
Data Analysis Library
Data Visualisation Library
Statistical Visualisation Library
PythonProgramming Language
PandasData Analysis Library
MatplotlibData Visualisation Library
SeabornStatistical Visualisation Library
Hands-on projects
Projects you actually ship, not just follow along with.
Each one lands in your portfolio with the working files, the process and something a reviewer can open.
Certification
Get certified in Data Analytics with Python
Finish the Data Analytics with Python programme at techcadd Ludhiana and you leave with more than a line on a CV — a verifiable certificate, and the project work that makes it mean something in an interview.
Course completion certificate
Issued in your name on completion of the Data Analytics with Python syllabus, with a reference number an employer can verify with us.
Project certificate
A separate certificate for the capstone you submit, naming the project so the work is attached to the credential.
Internship letter
Students who complete the live-project phase receive an internship letter covering the duration and the work delivered.
Portfolio you own
Every file, repository and deployed link stays yours — the part of the credential a reviewer can actually open.
techcadd has been training in Ludhiana since 2007. The certificate carries that record; the Data Analytics with Python work you did carries the rest.
Course completion
This is to certify that
has successfully completed the Data Analytics with Python programme
Data Analytics with Python
Project & internship
This is to certify that
for project work delivered under supervision in Ludhiana
Data Analytics with Python capstone
Where it takes you
Where this course takes you
The route from your first module to the roles Data Analytics with Python opens — and the work that has to exist at each step.
01Learning
02Projects
03Portfolio
04Industry readiness
05Career opportunities
Data Analyst Trainee
Demonstrate the ability to inspect datasets, calculate descriptive statistics and communicate findings through charts.
Junior Data Analyst
Use structured analytical workflows to explore data and prepare clear summaries for further analysis.
Reporting Analyst Trainee
Translate numerical information into charts, comparisons and concise analytical observations.
Data Intern
Support supervised analytical tasks by examining datasets and producing statistics and visualisations.
Salary outlook
What Data Analytics with Python pays, and where
Indicative ranges for the roles this course opens — what a fresher out of Ludhiana is offered, what the metro and remote markets pay for the same skills, and how that moves with two or three years of work behind you.
Indicative annual packages by role and market
Role
Ludhiana & Punjab
Delhi NCR & Bengaluru
Remote & freelance
Data Analyst TraineeEntry
₹2.4–4.2 LPA
₹4–8 LPA
₹20k–45k / project
Junior Data AnalystEntry to mid
₹3.6–6.5 LPA
₹6.5–14 LPA
₹35k–90k / project
Reporting Analyst TraineeEntry to mid
₹3.6–6.5 LPA
₹6.5–14 LPA
₹35k–90k / project
Data InternMid
₹3.6–6.5 LPA
₹6.5–14 LPA
₹35k–90k / project
Ranges are indicative, drawn from what our own students report and from openings we see through the placement cell. Actual offers depend on your portfolio, the interview and the company — nobody can promise you a number, and we do not.
Data Analyst Trainee, Junior Data Analyst, Reporting Analyst Trainee, Data Intern and related positions, depending on which part of the syllabus you go deepest on.
The first jump usually comes at 18–24 months, once you have shipped work you can point to. Depth in one area moves it faster than breadth across many.
Yes, and a good number of our students do. Remote and contract work is the reason Ludhiana candidates now compete for the same briefs as metro ones — the portfolio travels, the address does not matter.
IT services, manufacturing and export units running automation, e-commerce and D2C brands, healthcare, education, and the agencies serving all of them. Punjab hiring is broader than it looks from a job board.
It helps with the practical half. The projects and tooling carry into an M.Tech, MCA or a specialisation abroad, and the portfolio is often what separates two applicants with the same marks.
Next batch
Enquire about Data Analytics with Python
Send this form and a counsellor calls you back about this course
specifically — batch dates, fees and whether it fits what you already
know.
The 7 things people ask most often about the Data Analytics with Python course at techcadd Ludhiana.
The complete Data Analytics with Python programme runs for Flexible batches depending on the batch you choose. Weekday, weekend and fast-track options are available, along with shorter modules for students who only need the fundamentals.
School students after 12th, college students from any stream, graduates and working professionals changing track. The first module assumes no prior experience.
No. The course starts from the basics. If you already have some background, your trainer will move you faster through the first module so you reach the project work sooner.
Python, Pandas, Matplotlib and Seaborn — plus the day-to-day tooling and workflow that surrounds them in a real team.
Yes. Each module closes with a lab project, and the course ends with a capstone you can put on your portfolio and defend in an interview.
Placement support includes resume and portfolio review, aptitude and role-specific practice, mock interviews and interview referrals through our hiring network.
Yes. You receive a techcadd Data Analytics with Python completion certificate, and a separate project certificate for the capstone you submit.
Why this course
Why should you choose this course?
Six things we hold ourselves to for every Data Analytics with Python batch that starts in Ludhiana.
01
EDA Skills
Learn a structured process for investigating unfamiliar datasets.
02
Statistical Analysis
Use descriptive statistics to summarise and compare information.
03
Visualisation Practice
Create and interpret charts using Matplotlib and Seaborn.
04
Dataset Projects
Apply analytical techniques to structured datasets rather than isolated commands.
05
EDA Report
Produce a practical report combining observations, statistics and visualisations.
Why TechCadd
Why students choose us for this
The course keeps data exploration separate from predictive modelling so learners first understand how to analyse and explain a dataset correctly.
Analysis before modelling
Develop EDA and statistical reasoning before progressing into machine learning.
Practical visualisation
Use Matplotlib and Seaborn to answer analytical questions rather than creating charts without context.
Dataset-based learning
Work through complete datasets so statistics and charts remain connected to real analytical tasks.
Structured workflow
Follow a repeatable sequence from inspection and statistics to visualisation and interpretation.
Clear deliverable
Complete an EDA report that demonstrates both numerical and visual analysis skills.
Future scope
What Comes After Exploratory Data Analysis?
Once learners can inspect, summarise and explain datasets, they are better prepared to progress into predictive modelling and more advanced analytical techniques.
Year 0–1
Get in on proof of work
Entry roles such as Data Analyst Trainee open as soon as you have projects that run. At this stage nobody is asking about your marks — they are asking you to walk through something you built.
Year 2–4
Specialise and get paid for it
The generalists plateau; the specialists do not. Depth in one part of Data Analytics with Python — the part your first job leans on hardest — is what moves you towards junior data analyst work.
Year 5+
Own the decisions
Architecture, standards, hiring and mentoring. The technical skill is assumed by now; what you are paid for is judgement, and judgement only comes from having shipped things that mattered.
Evidence-Based Analysis
Charts and statistics help analysts support observations with measurable evidence.
Visual Communication
Analytical findings are easier to communicate when the selected visual matches the question being answered.
EDA Before Modelling
Exploring a dataset before training a model helps identify quality issues, distributions and relationships that can affect later results.
Data analytics skills can support analytical work across
Manufacturing
Retail
Finance
IT Services
Education
Business Services
The comparison
Why students pick techcadd for Data Analytics with Python
This comparison focuses on the depth of practical exploratory analysis rather than unsupported claims about individual training providers.
techcadd compared with a other institutes, feature by feature
What to ask about
techcadd
Other institutes
Analytical workflow
Moves from dataset inspection to statistics, visualisation and reporting.
Workflow structure varies by course.
EDA
EDA is treated as a practical analytical process.
EDA depth varies between curricula.
Statistics
Descriptive statistics are connected directly to dataset interpretation.
Statistical coverage varies by programme.
Matplotlib
Charts are created around specific analytical questions.
Visualisation depth depends on course structure.
Seaborn
Statistical visualisations support distribution and relationship analysis.
Tool coverage varies.
Final deliverable
Learners work toward a structured EDA report.
Final project requirements differ by programme.
Compare analytics training by whether learners can interpret and explain datasets, not just generate charts.
Student Voices
WhatDataAnalyticswithPythonlearnerssay
Feedback from students who completed the Data Analytics with Python programme at techcadd Ludhiana.
Google Reviews4.8from 181 Google reviewsGoogle Verified
SK
Simranjeet Kaur
Data Analytics with Python / B.Sc. IT graduate
I joined with no background in this. By the third month I was building Data Analytics with Python work on my own, and the project reviews are where I actually learnt to do it properly.
HS
Harman Sethi
Data Analytics with Python / Now working as an intern in the field
The classes are practical. Every session ends with a task that has to work, so you cannot fake understanding. That habit helped me most in interviews.
AV
Ankit Verma
Data Analytics with Python / BCA final year
Doubt support was the difference for me. My trainer sat with my work, found the mistake and made me fix it myself instead of handing over the answer.
SK
Simranjeet Kaur
Data Analytics with Python / B.Sc. IT graduate
I joined with no background in this. By the third month I was building Data Analytics with Python work on my own, and the project reviews are where I actually learnt to do it properly.
HS
Harman Sethi
Data Analytics with Python / Now working as an intern in the field
The classes are practical. Every session ends with a task that has to work, so you cannot fake understanding. That habit helped me most in interviews.
AV
Ankit Verma
Data Analytics with Python / BCA final year
Doubt support was the difference for me. My trainer sat with my work, found the mistake and made me fix it myself instead of handing over the answer.
NS
Navjot Singh
Data Analytics with Python / Career switch from operations
I came for the skill and left with a portfolio — projects I could actually demo on a call, not a certificate I had to explain.
SK
Simranjeet Kaur
Data Analytics with Python / B.Sc. IT graduate
I joined with no background in this. By the third month I was building Data Analytics with Python work on my own, and the project reviews are where I actually learnt to do it properly.
HS
Harman Sethi
Data Analytics with Python / Now working as an intern in the field
The classes are practical. Every session ends with a task that has to work, so you cannot fake understanding. That habit helped me most in interviews.
NS
Navjot Singh
Data Analytics with Python / Career switch from operations
I came for the skill and left with a portfolio — projects I could actually demo on a call, not a certificate I had to explain.
SK
Simranjeet Kaur
Data Analytics with Python / B.Sc. IT graduate
I joined with no background in this. By the third month I was building Data Analytics with Python work on my own, and the project reviews are where I actually learnt to do it properly.
HS
Harman Sethi
Data Analytics with Python / Now working as an intern in the field
The classes are practical. Every session ends with a task that has to work, so you cannot fake understanding. That habit helped me most in interviews.
AV
Ankit Verma
Data Analytics with Python / BCA final year
Doubt support was the difference for me. My trainer sat with my work, found the mistake and made me fix it myself instead of handing over the answer.
NS
Navjot Singh
Data Analytics with Python / Career switch from operations
I came for the skill and left with a portfolio — projects I could actually demo on a call, not a certificate I had to explain.
SK
Simranjeet Kaur
Data Analytics with Python / B.Sc. IT graduate
I joined with no background in this. By the third month I was building Data Analytics with Python work on my own, and the project reviews are where I actually learnt to do it properly.
AV
Ankit Verma
Data Analytics with Python / BCA final year
Doubt support was the difference for me. My trainer sat with my work, found the mistake and made me fix it myself instead of handing over the answer.
NS
Navjot Singh
Data Analytics with Python / Career switch from operations
I came for the skill and left with a portfolio — projects I could actually demo on a call, not a certificate I had to explain.
SK
Simranjeet Kaur
Data Analytics with Python / B.Sc. IT graduate
I joined with no background in this. By the third month I was building Data Analytics with Python work on my own, and the project reviews are where I actually learnt to do it properly.
HS
Harman Sethi
Data Analytics with Python / Now working as an intern in the field
The classes are practical. Every session ends with a task that has to work, so you cannot fake understanding. That habit helped me most in interviews.
AV
Ankit Verma
Data Analytics with Python / BCA final year
Doubt support was the difference for me. My trainer sat with my work, found the mistake and made me fix it myself instead of handing over the answer.
NS
Navjot Singh
Data Analytics with Python / Career switch from operations
I came for the skill and left with a portfolio — projects I could actually demo on a call, not a certificate I had to explain.
HS
Harman Sethi
Data Analytics with Python / Now working as an intern in the field
The classes are practical. Every session ends with a task that has to work, so you cannot fake understanding. That habit helped me most in interviews.
AV
Ankit Verma
Data Analytics with Python / BCA final year
Doubt support was the difference for me. My trainer sat with my work, found the mistake and made me fix it myself instead of handing over the answer.
NS
Navjot Singh
Data Analytics with Python / Career switch from operations
I came for the skill and left with a portfolio — projects I could actually demo on a call, not a certificate I had to explain.
Real, unedited feedback from techcadd learners on Google.
Keep exploring
Related courses you might like
More programs in AI & Data and beyond, taught the same hands-on, mentor-led way.